How to Create BI Analysis
Data Sources
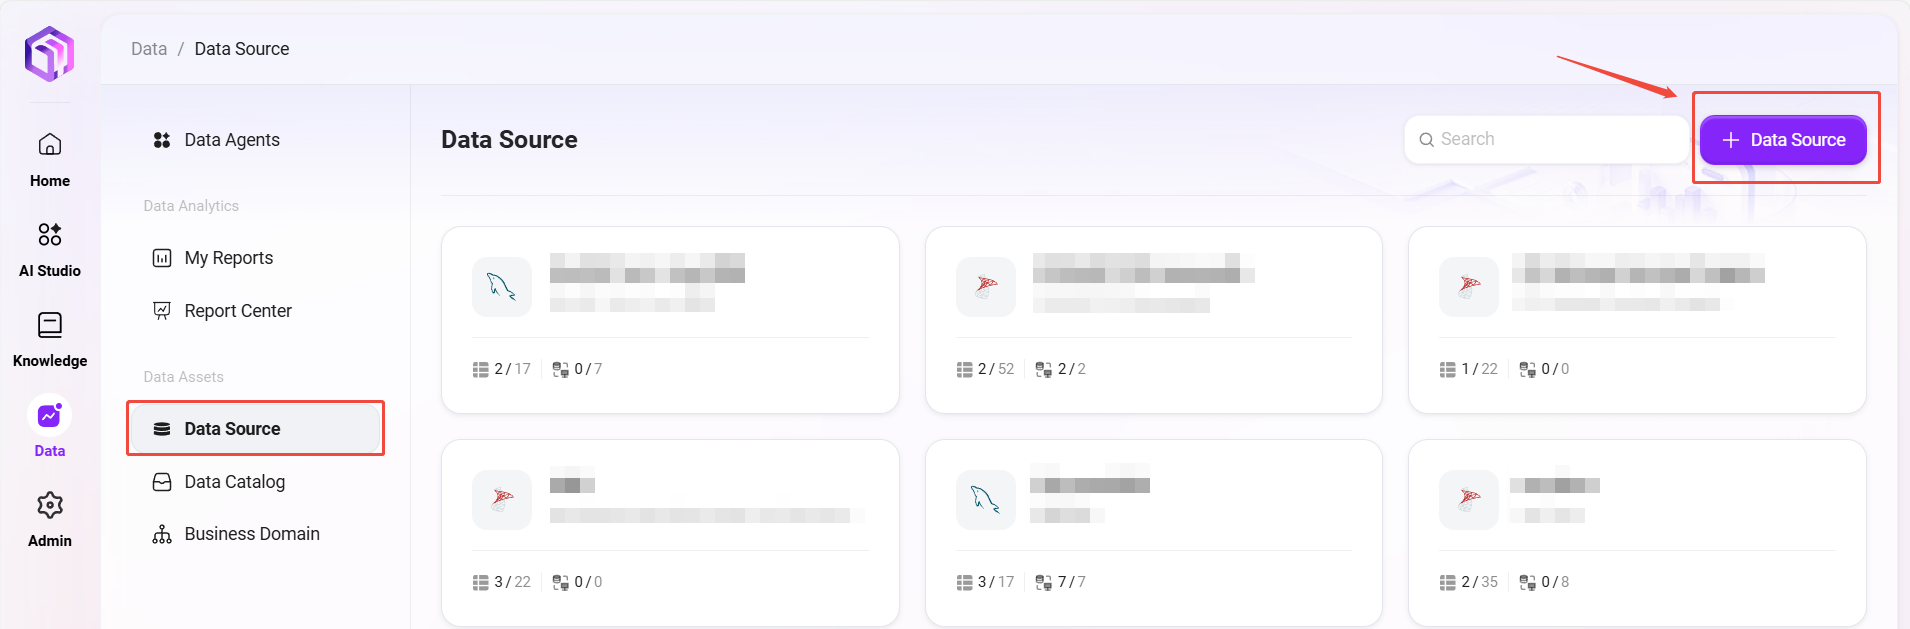
Connecting Data Sources
The first step in AI Data is connecting data sources to provide foundational data for subsequent analysis.
- Supports connecting to various mainstream data platforms, including MySQL, SQL Server, Azure Databricks, etc.;
- After adding a data source, you can view all tables within it, and users can selectively check the tables they need to use;
- The system by default only synchronizes metadata (such as table structure and field information), without synchronizing actual data records, ensuring data security;
- Provides a "Test Connection" feature to ensure the data source connectivity is correct;

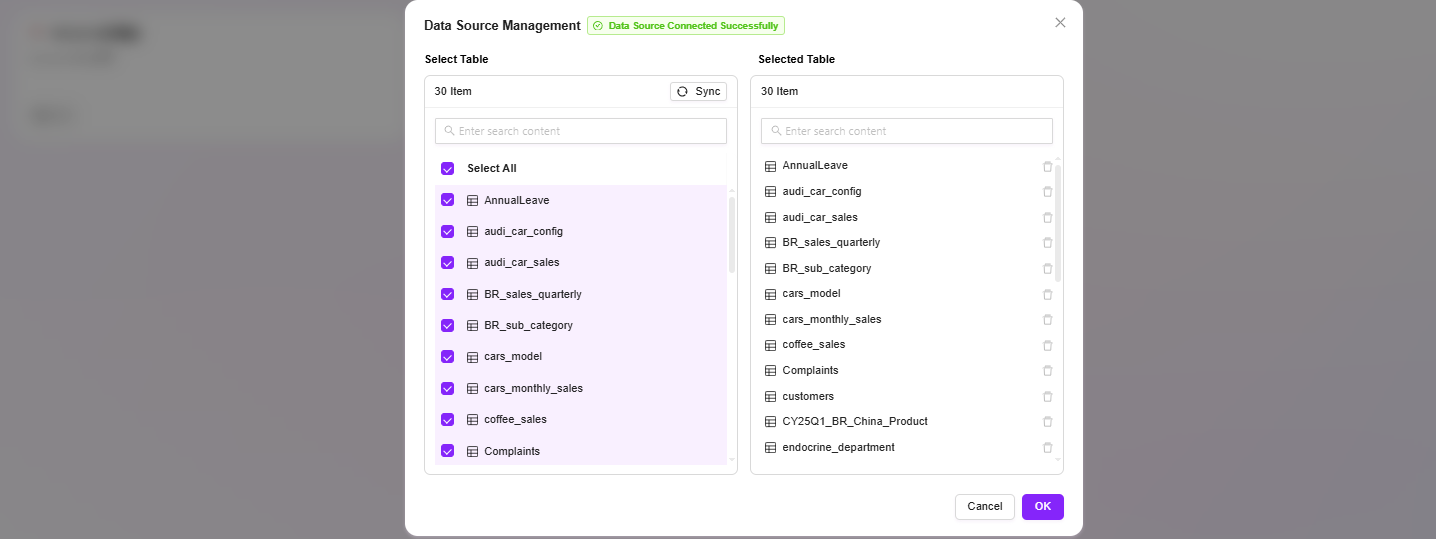
- After adding a data source, besides selecting data tables, views are also supported.
- Views can integrate data from multiple tables into a virtual table through query logic, suitable for displaying summarized, filtered, or calculated results, facilitating the construction of more flexible data models.
Data Catalog
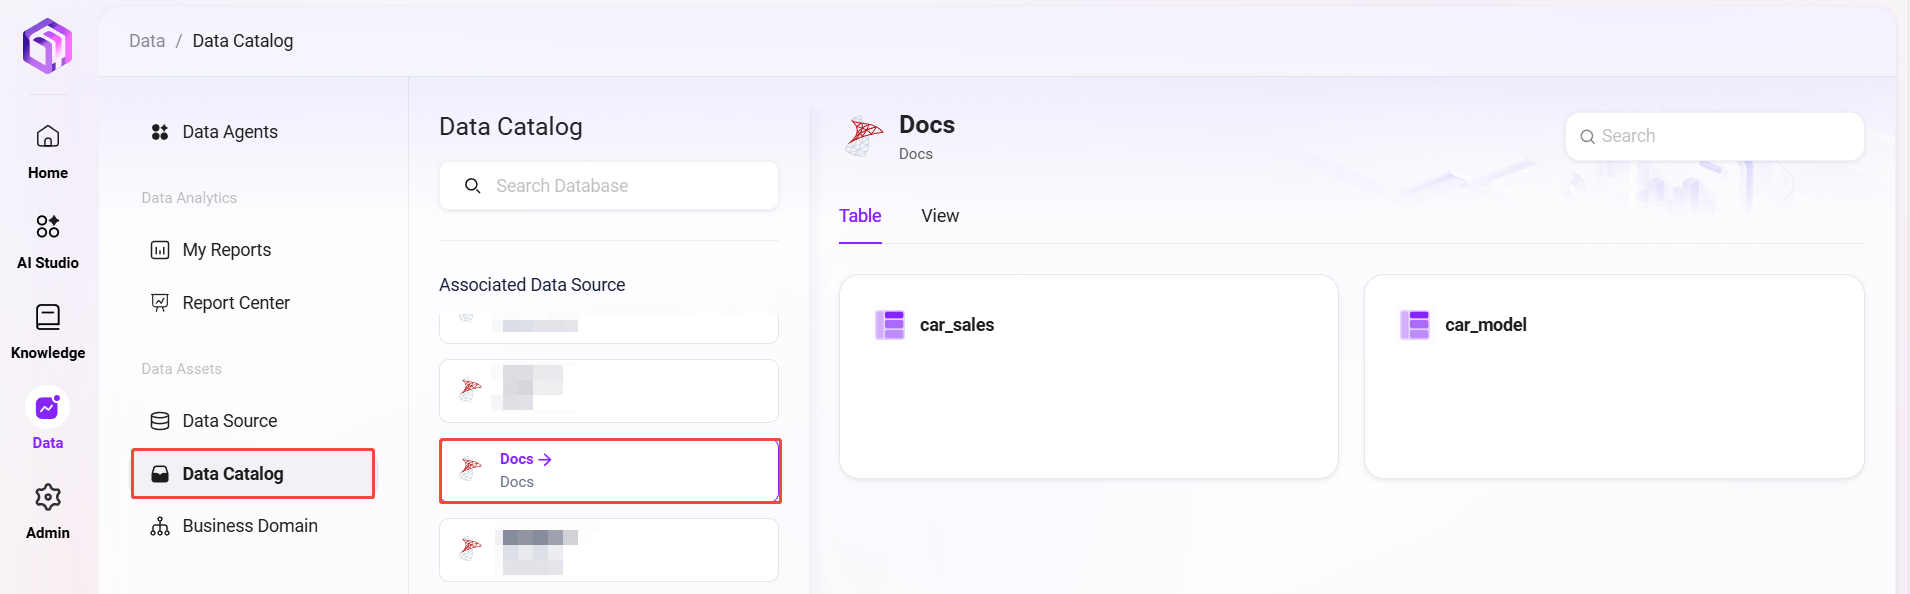
Managing Data Catalog
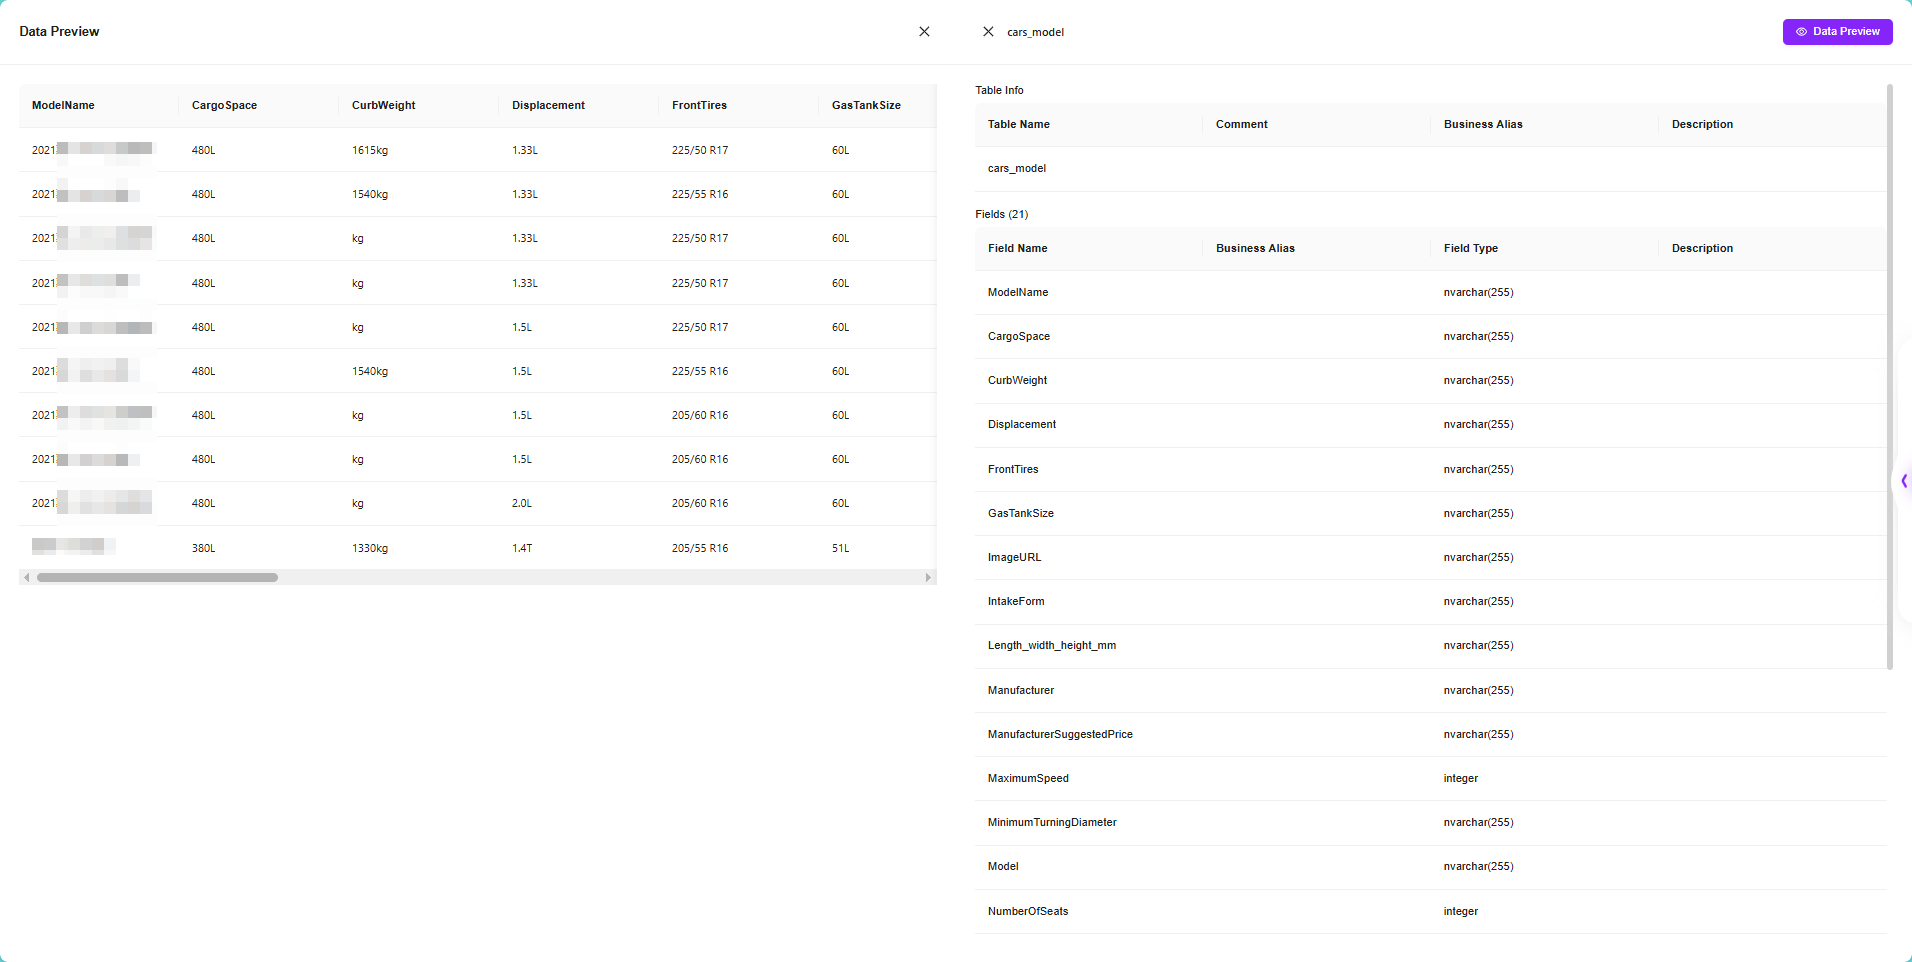
After connecting data sources, users can view and manage the synchronized tables in the "Data Catalog" module.
- Only displays tables checked in the data source;
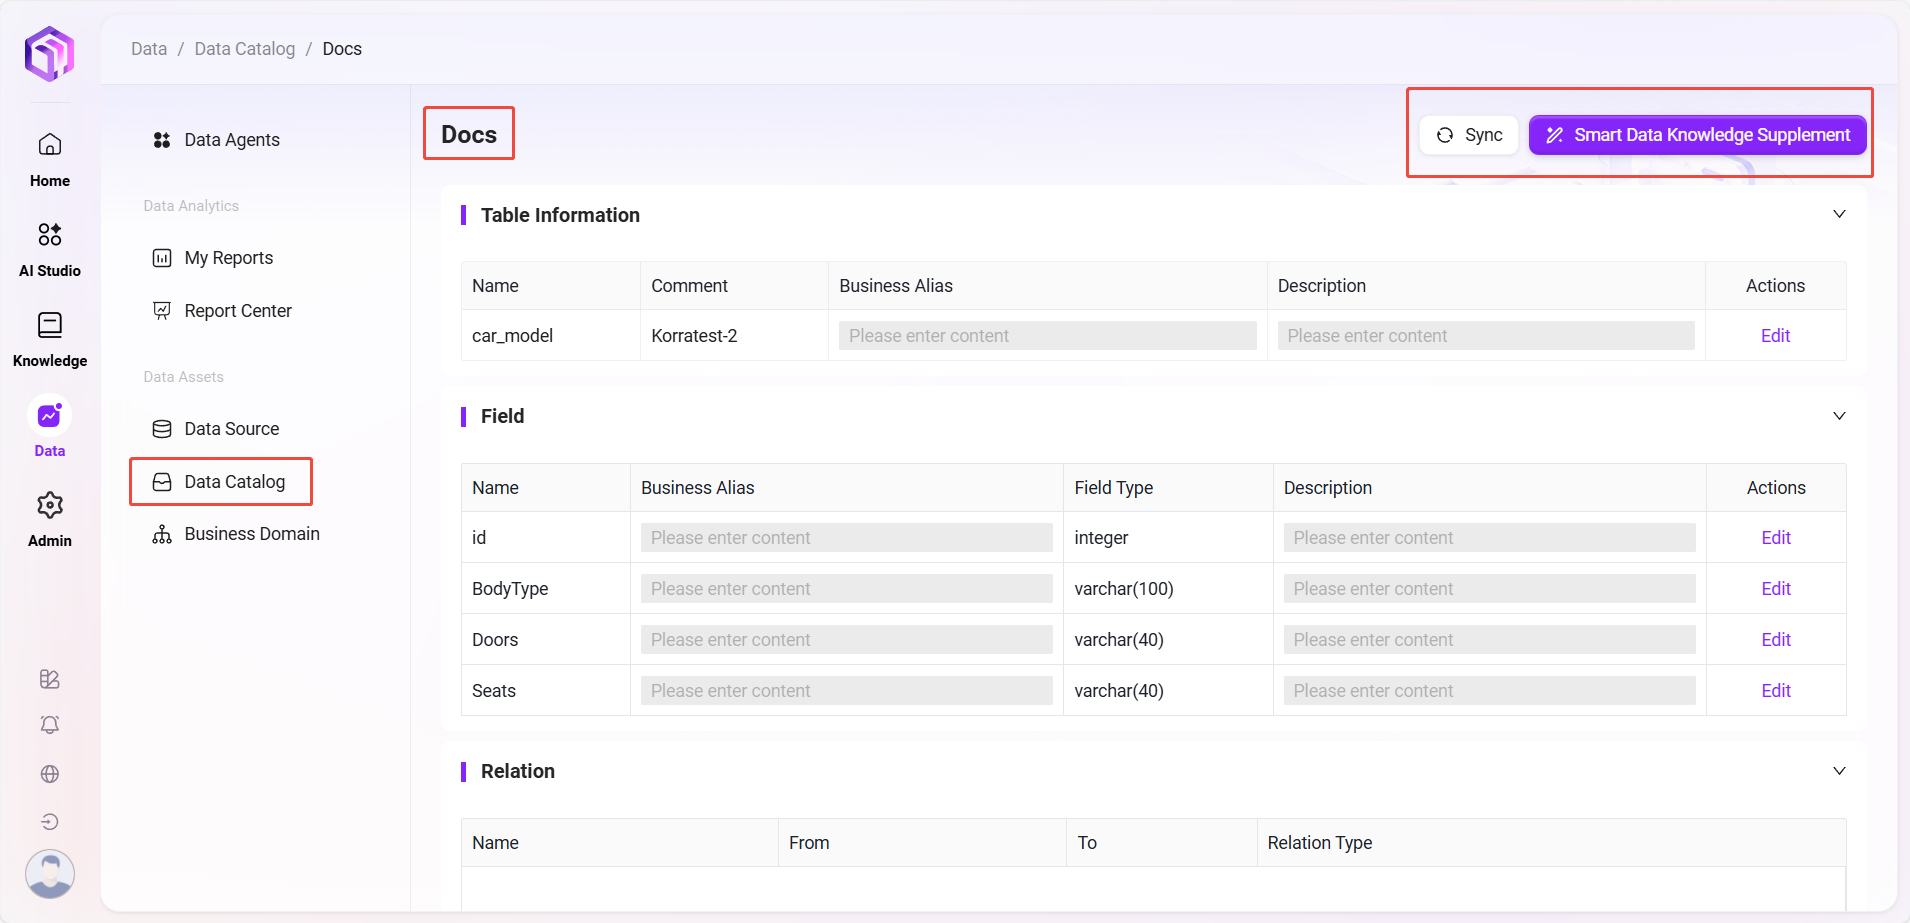
- Supports viewing each table's table name, business description, field names, and field descriptions;
- Displays the relationships between this table and other tables, including related tables, related fields, and relationship types (such as primary-foreign key);
- Supports one-click triggering of "Intelligent Data Knowledge Supplement", where the system automatically generates business aliases and descriptions for tables and fields based on AI and schema;
- Supports "Data Table Synchronization" to reload updated table structures.
Business Domain
Building Data Models
To help the system better understand the business relationships between data, it is necessary to build "Business Domains" and define logical relationships between tables.
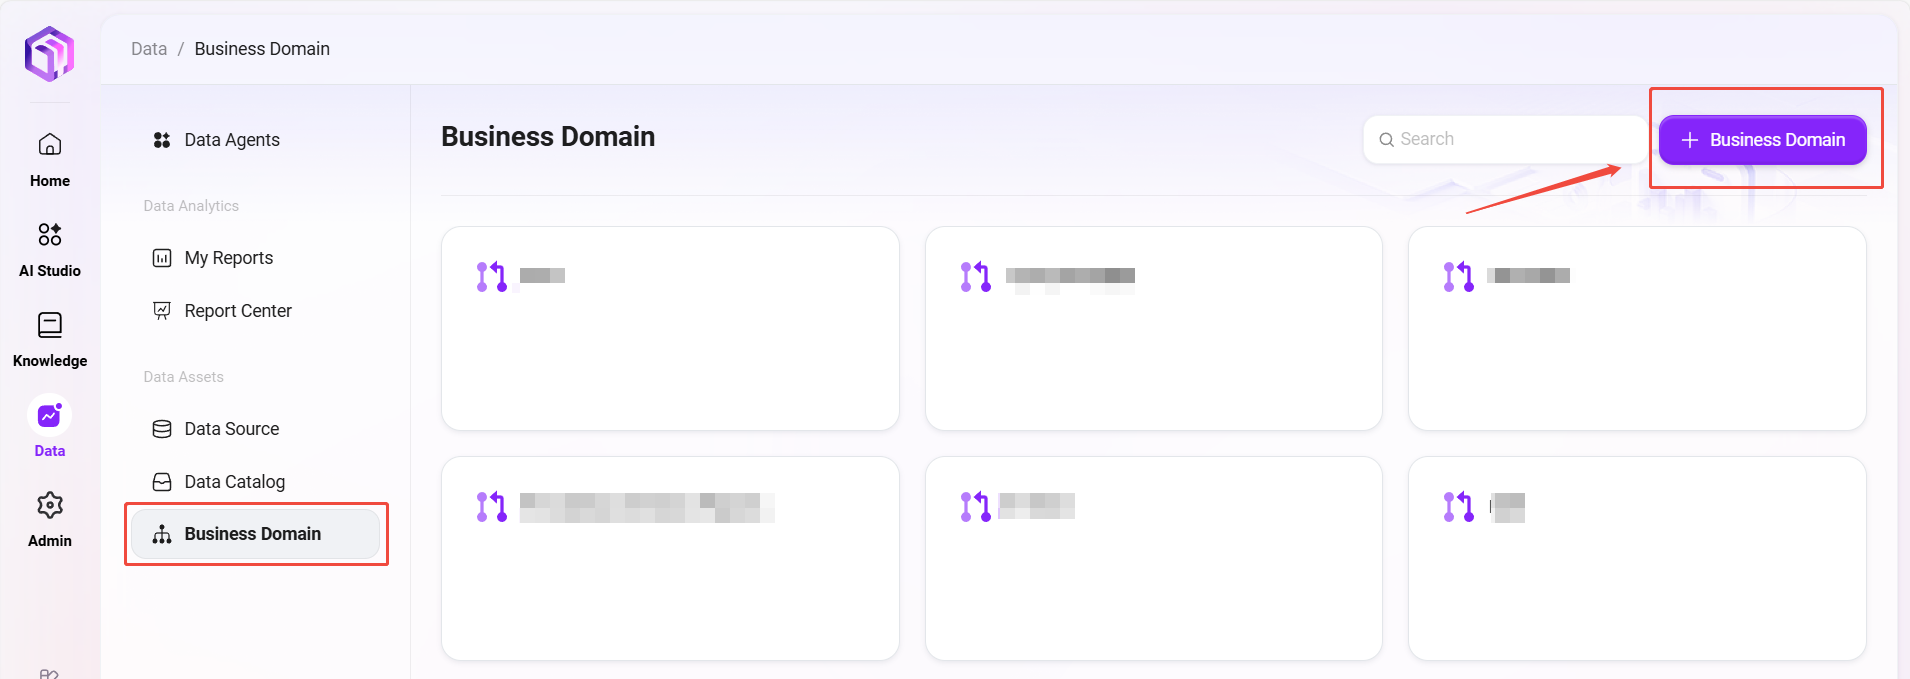
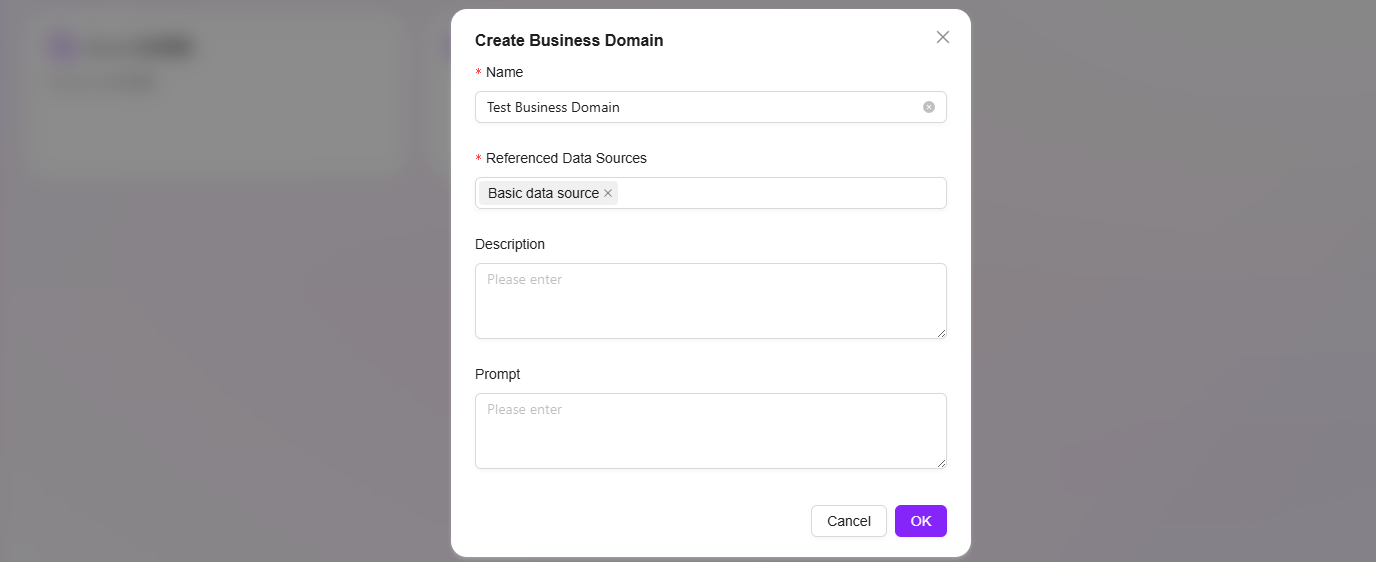
1. Create a New Business Domain
- Enter the name of the business domain;
- Select the referenced data source;
- After creation, you can enter the business domain management interface.
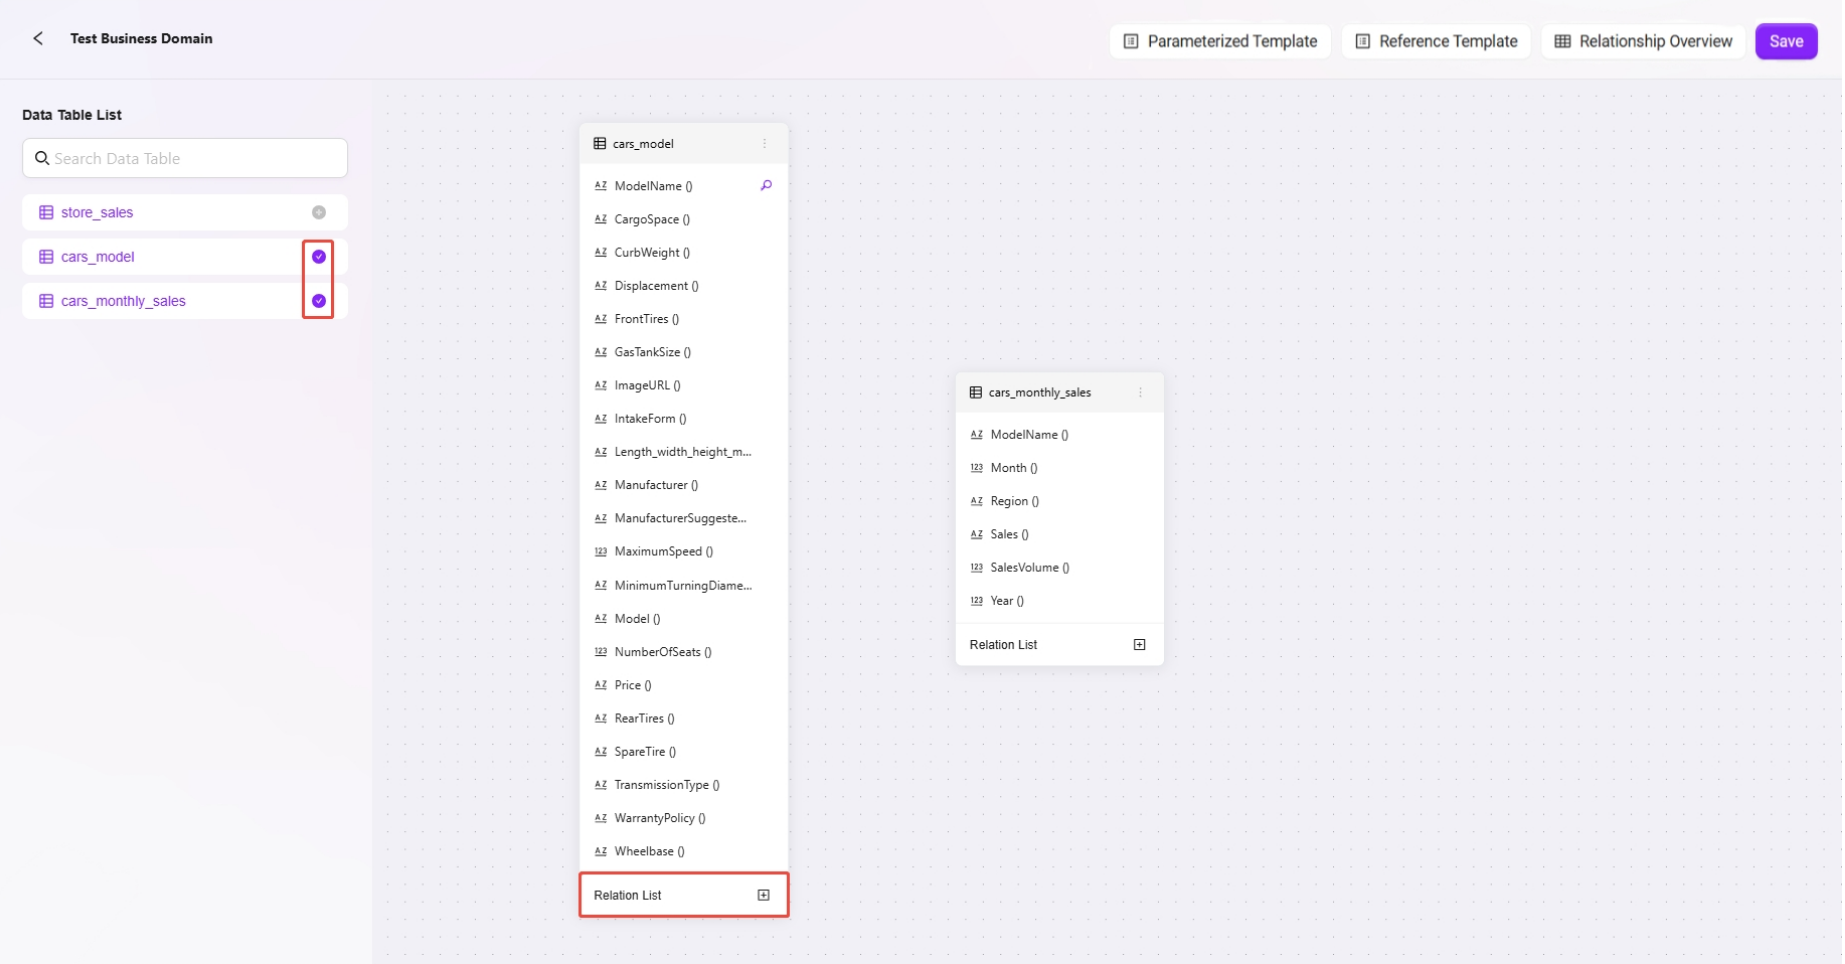
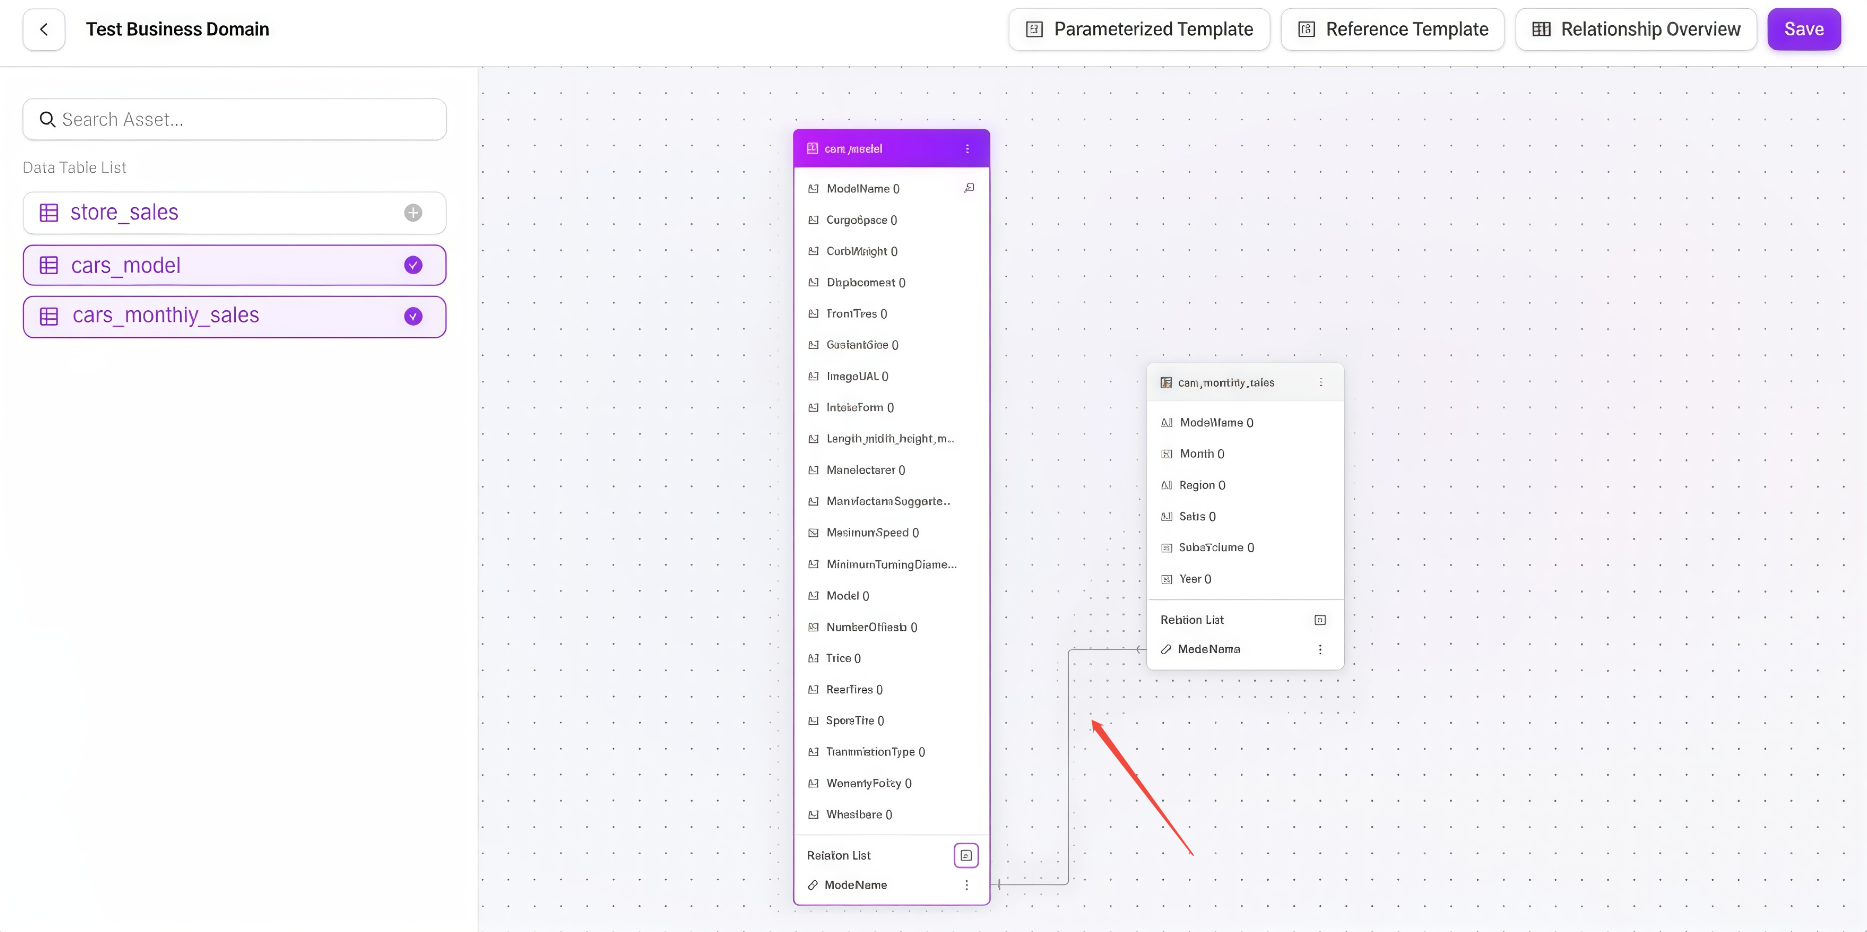
2. Add Data Tables and Relationship Modeling
- Add multiple business-related data tables as "Business Domain Nodes";
- Each node represents a table, and multiple nodes can be added;
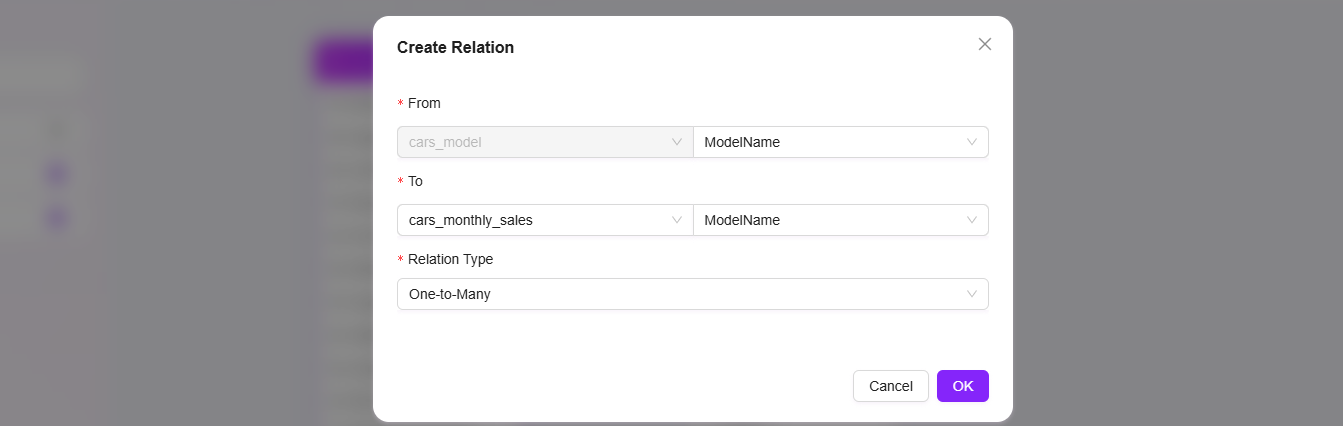
- Click the "Relationship List" of each table node to add relationships:
- Set the From field (field in the current table);
- Set the To table and its field (target table and target field);
- Choose the relationship type: one-to-one, one-to-many, many-to-one, many-to-many;
- Submit to complete the binding of the relationship between the two tables.
In this way, users can build a complete data relationship network within the business domain, facilitating subsequent intelligent queries and chart generation.
3. SQL Template Modeling
- Supports creating business relationship templates using SQL statements;
- Templates include natural language questions and corresponding SQL queries;
- Suitable for configuration by IT administrators, allowing business users to directly call and use, reducing the learning curve.
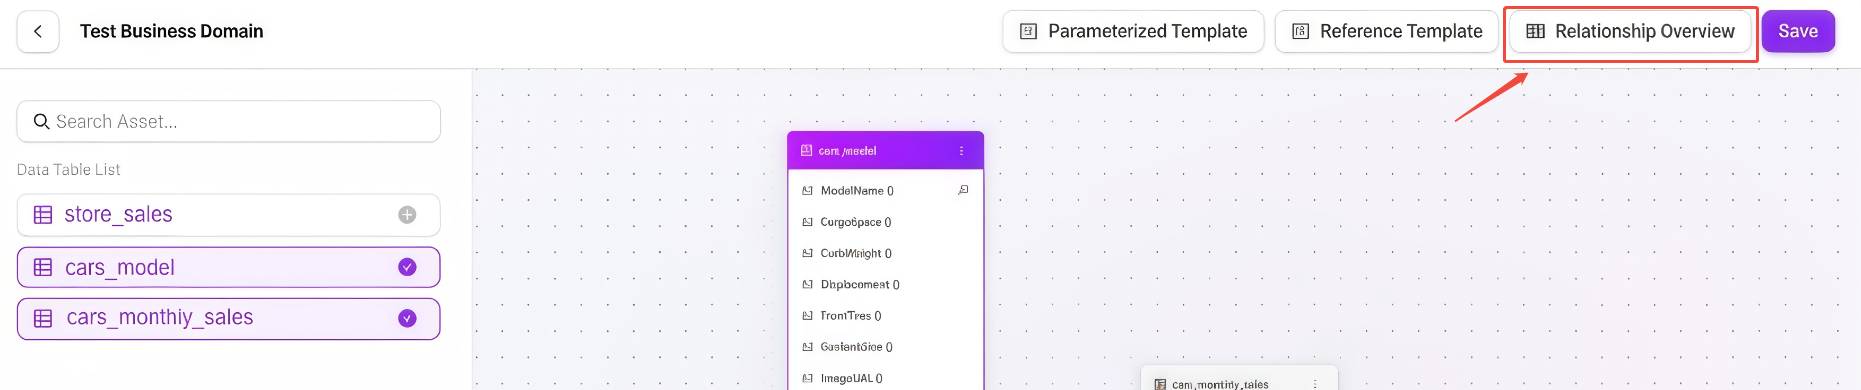
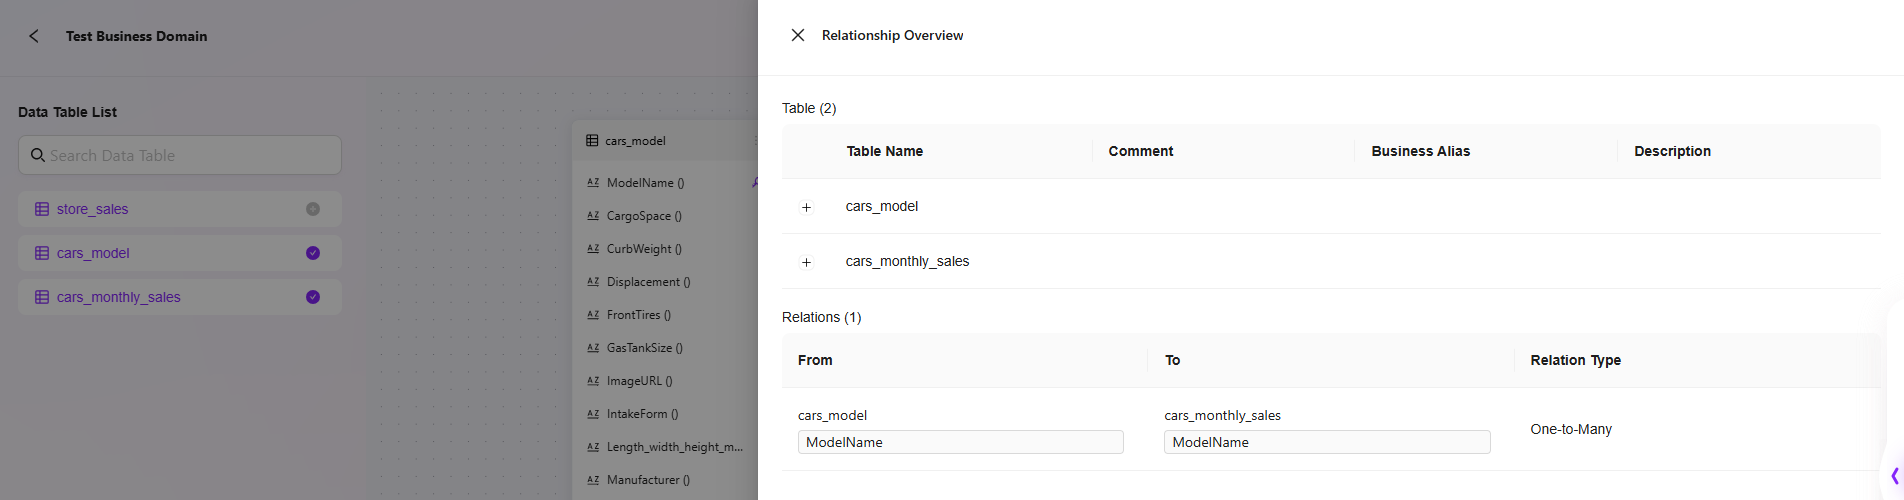
4. Relationship Overview
- Displays all tables in the business domain and their structural relationships, facilitating global understanding and management.
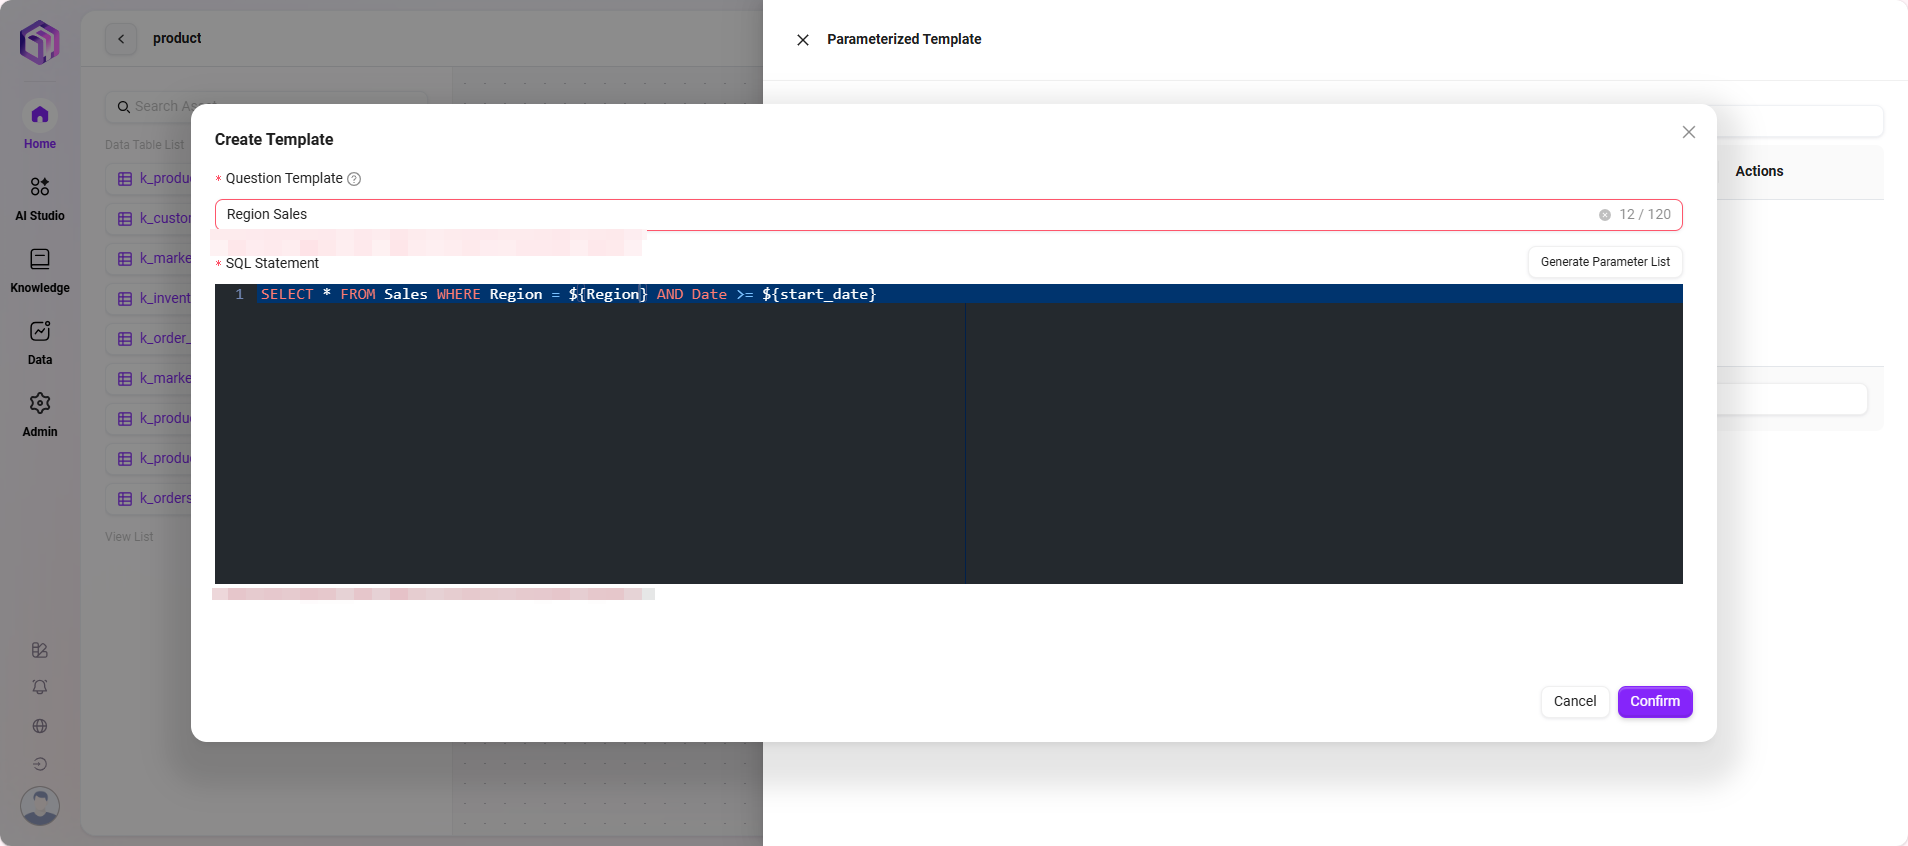
Parameterized Templates
Supports creating SQL templates with parameterized variables to flexibly meet data query needs in different scenarios.
- Parameters (such as date, department, region, etc.) can be defined in the template and inserted into SQL statements as placeholders;
- When called, users can input different parameter values, and the system will automatically generate the corresponding SQL query;
- Suitable for common queries that require flexible condition adjustments, significantly improving reusability and query efficiency;
- Parameters can have default values and input restrictions to ensure query accuracy and security.
Example:
SELECT * FROM Sales WHERE Region = ${region} AND Date >= ${start_date}
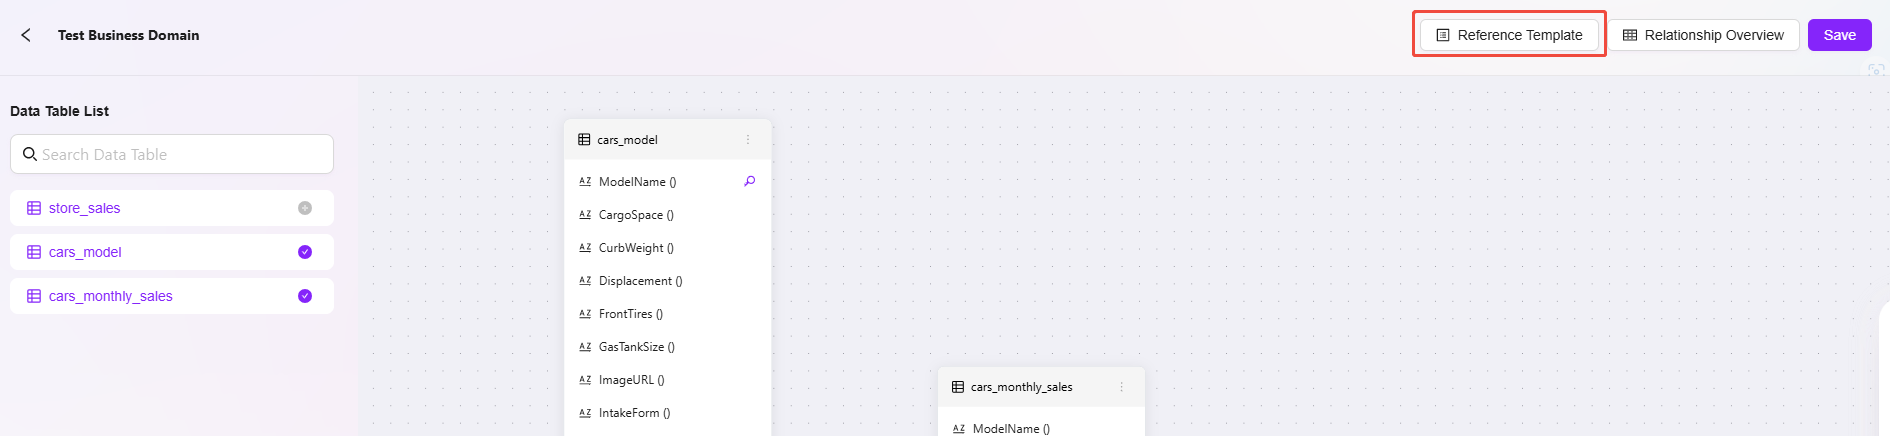
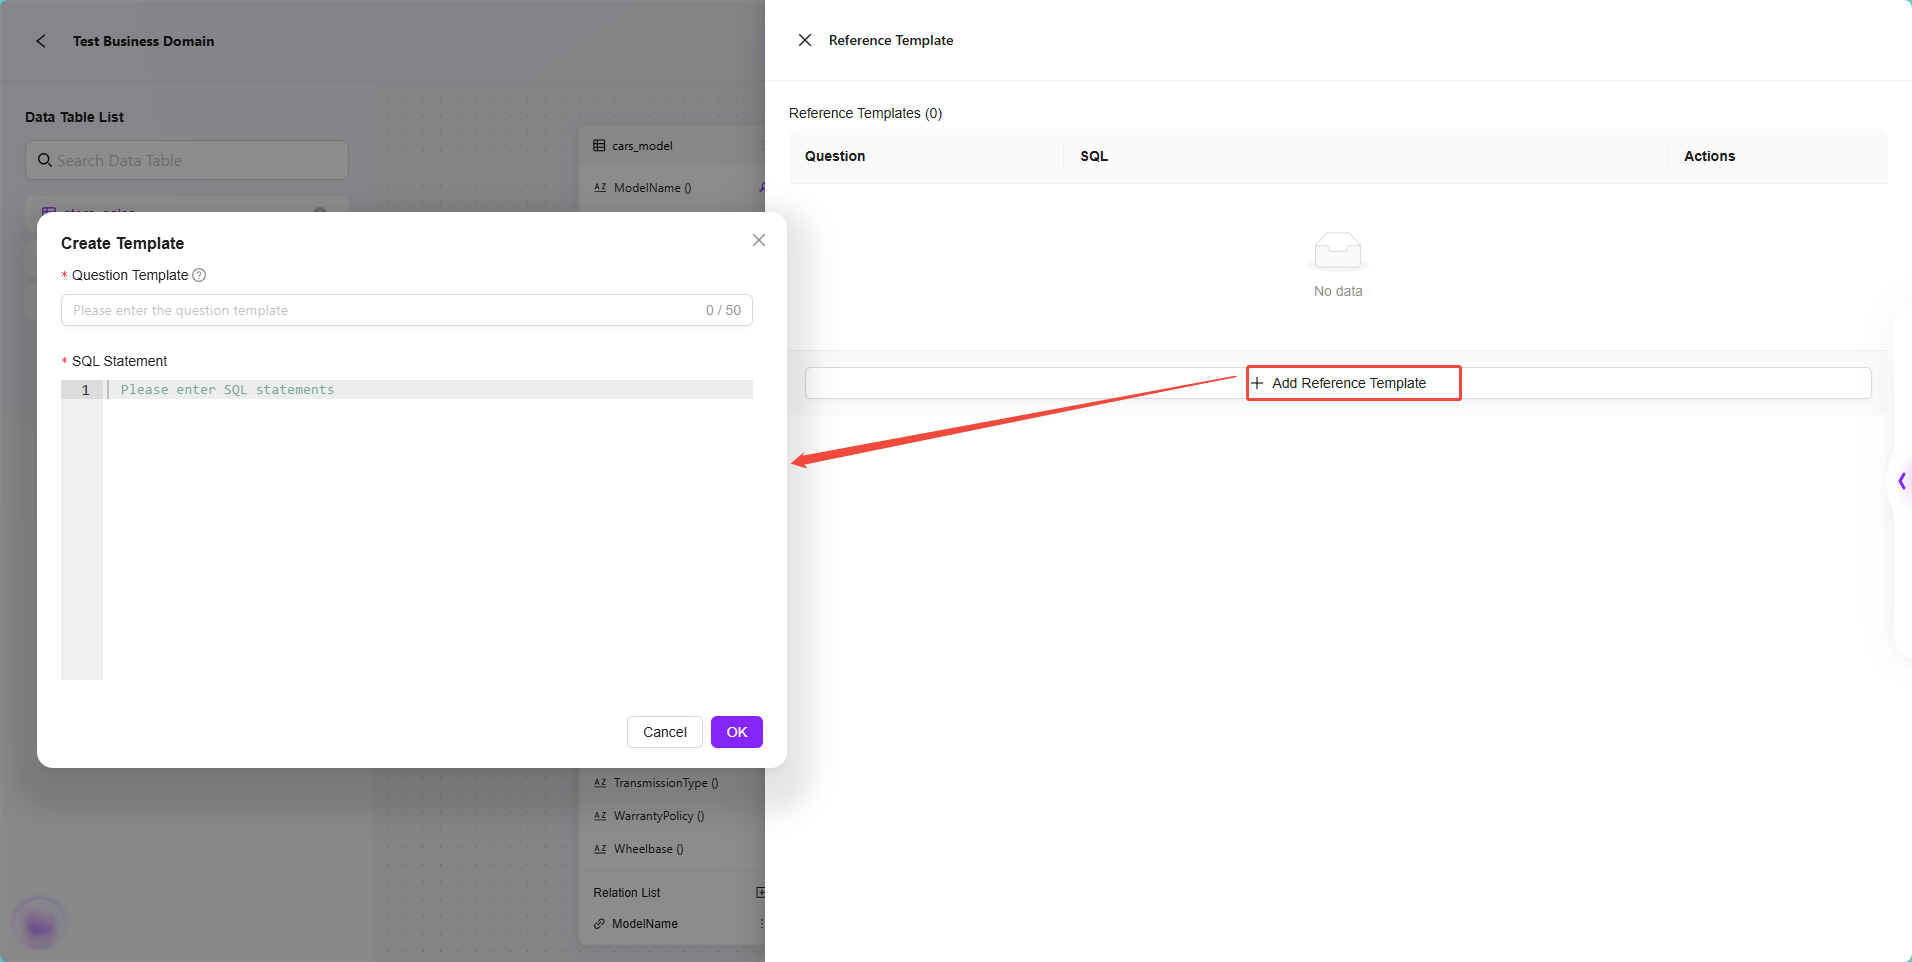
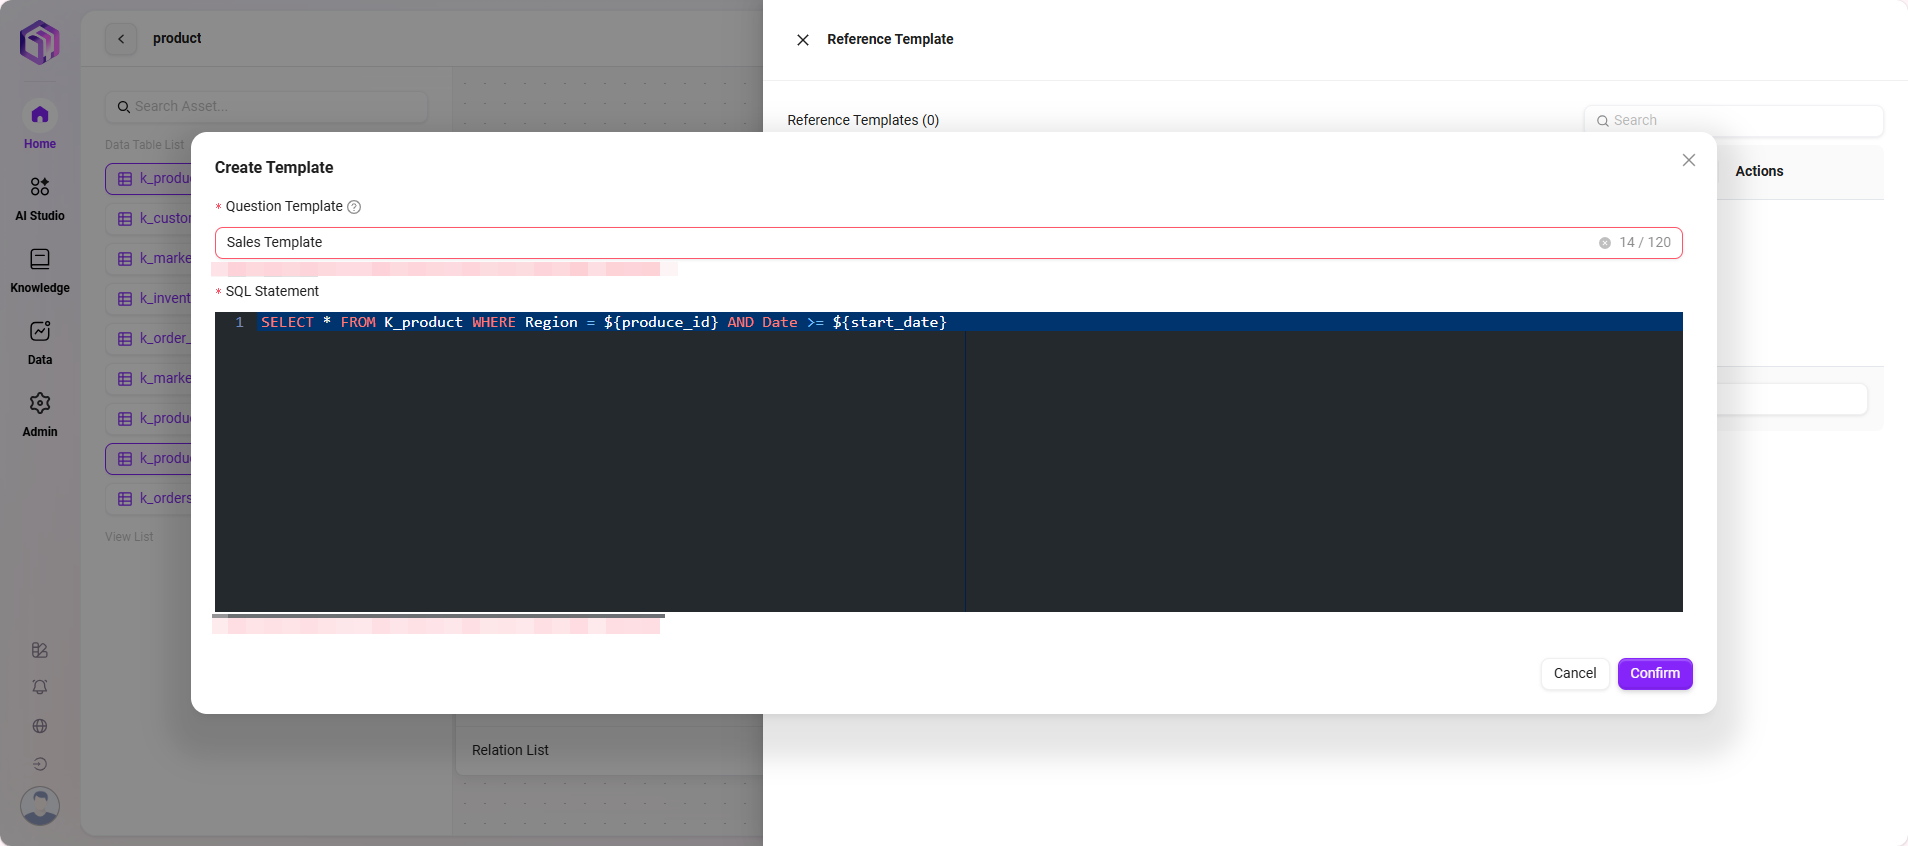
Reference Templates
Provides a series of system preset query templates to help users quickly understand and reuse standardized modeling methods.
- Template examples cover common business scenarios such as sales analysis, inventory statistics, customer profiling, etc.;
- Users can refer to the logical structure and field settings of templates to customize models that fit their own business needs;
- Supports copying, modifying, and saving based on reference templates to quickly build personalized data relationship models;
- Facilitates unified data modeling standards within teams, improving overall usage consistency.
Intelligent BI
Intelligent Analysis and Chart Generation
After building the business domain, users can perform visual analysis in the "Intelligent BI" module.
1. Select Business Domain
- After entering Intelligent BI, select an existing business domain;
- The left side will display the data tables under that domain;
- Supports data table preview, including field names and sample data.
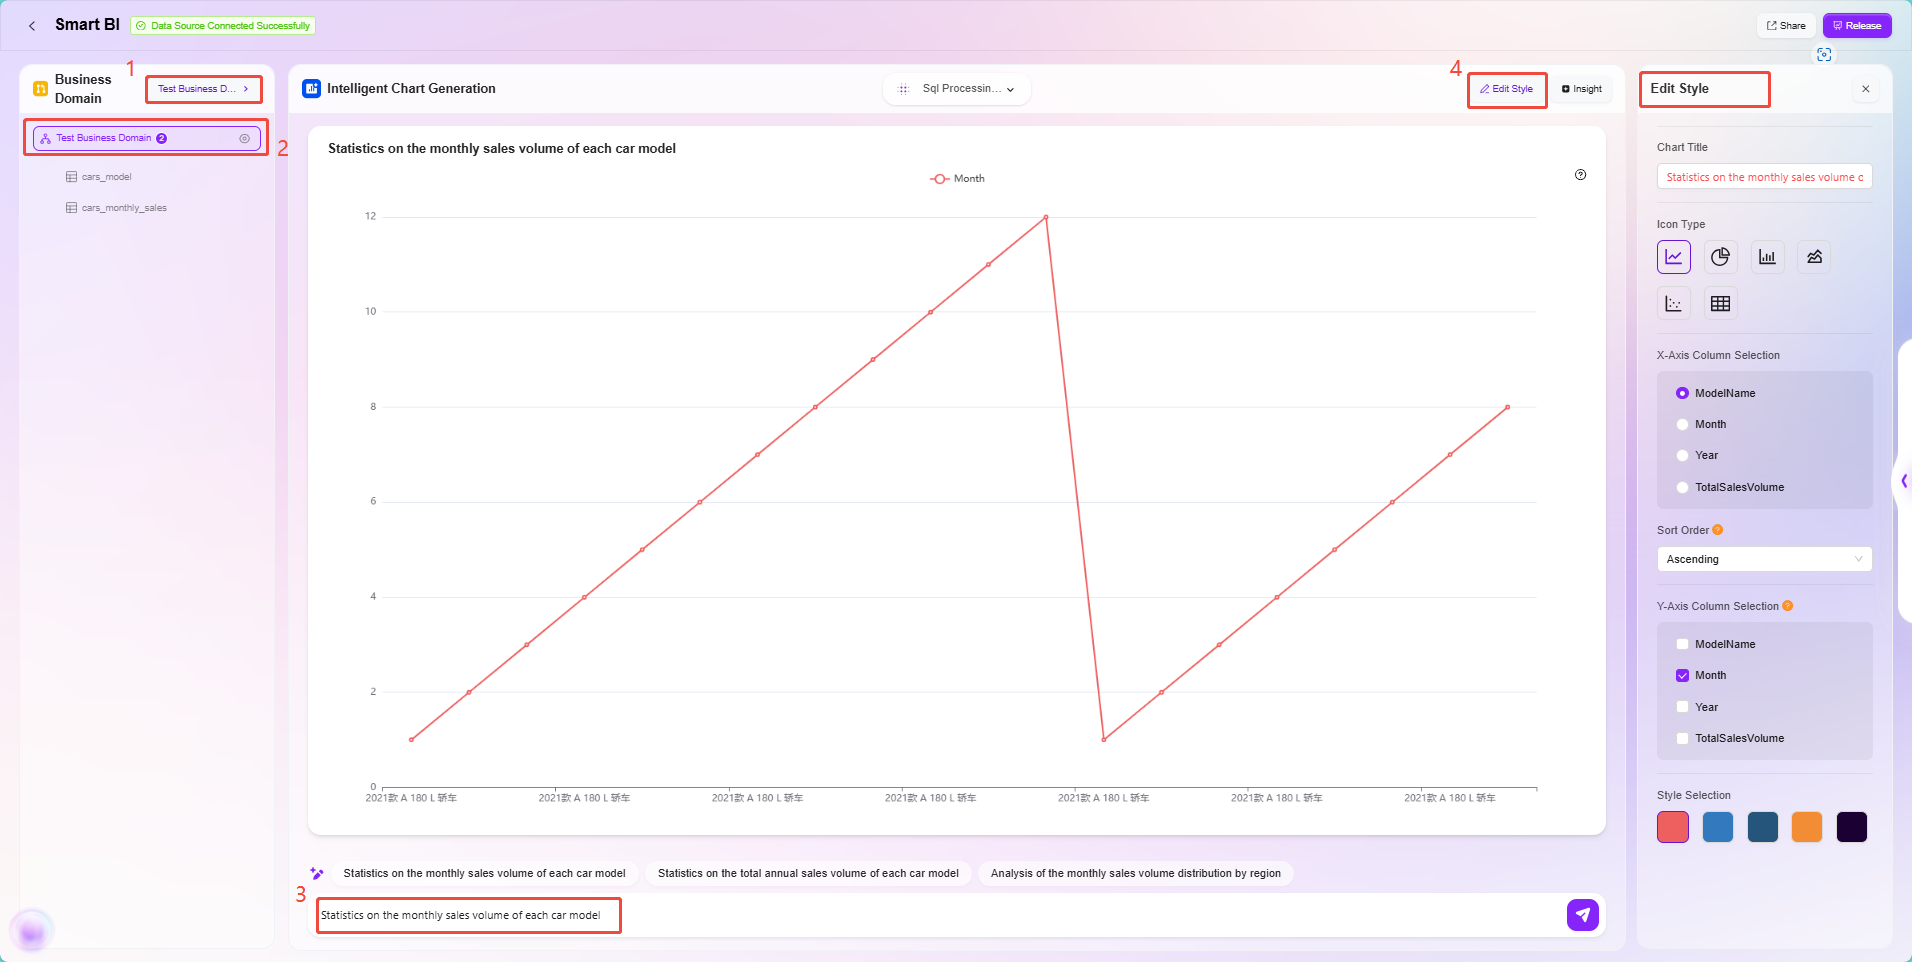
2. Intelligent Chart Generation
- Enter chart requirements in the input box, supporting natural language queries, such as:
- "Sales trend in the last 7 days"
- "Order volume grouped by region"
- The system automatically converts the semantic recognition into SQL queries and generates corresponding charts;
- Supports various chart types including bar charts, line charts, scatter plots, etc.;
- Optimizes and suggests completions for user input, very suitable for business users without technical background;
- Charts support editing, including title, chart type, XY axis settings, color styles, etc.
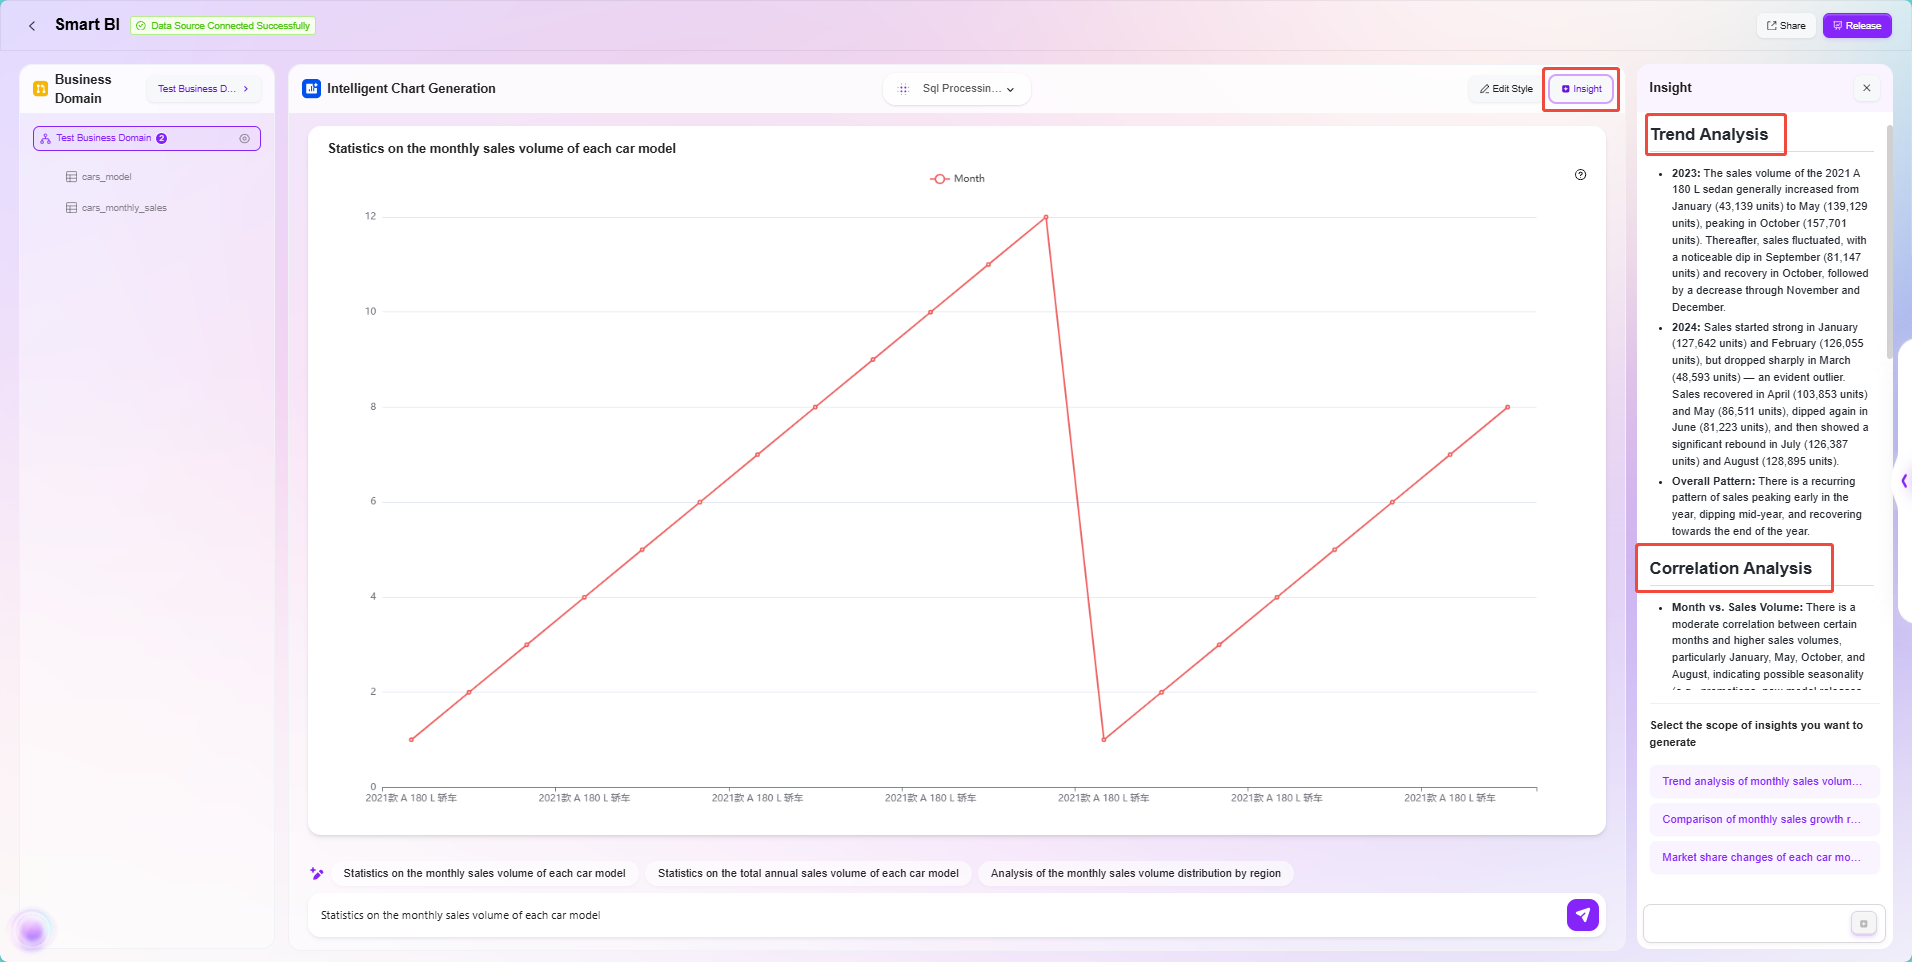
3. Data Insight Analysis
- Click "Insights" on the right side of the BI interface;
- The system uses AI to automatically analyze data trends, anomalies, and possible causes;
- Helps users quickly discover key business issues and supports business decision-making.
My Analysis & Analysis Center
Analysis Publishing and Sharing
After completing analysis adjustments, analyses can be published and shared.
1. Analysis Publishing
- Supports publishing analyses to:
- My Analysis (personal visibility);
- Analysis Center (organization-wide sharing);
- Supports setting and selecting analysis categories during publishing.

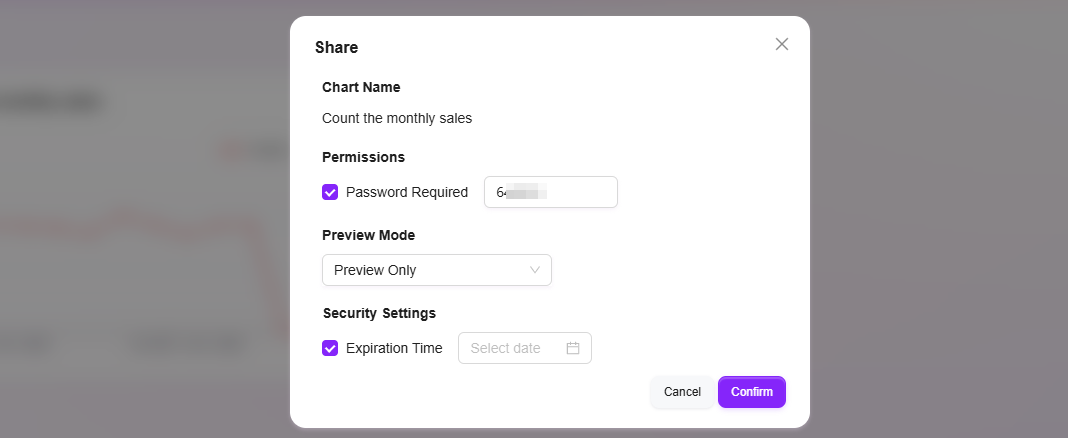
2. Analysis Sharing
- Supports settings for:
- Whether to enable password protection;
- Access permissions (view only);
- Expiration time limits;
- Can quickly share with others via links.
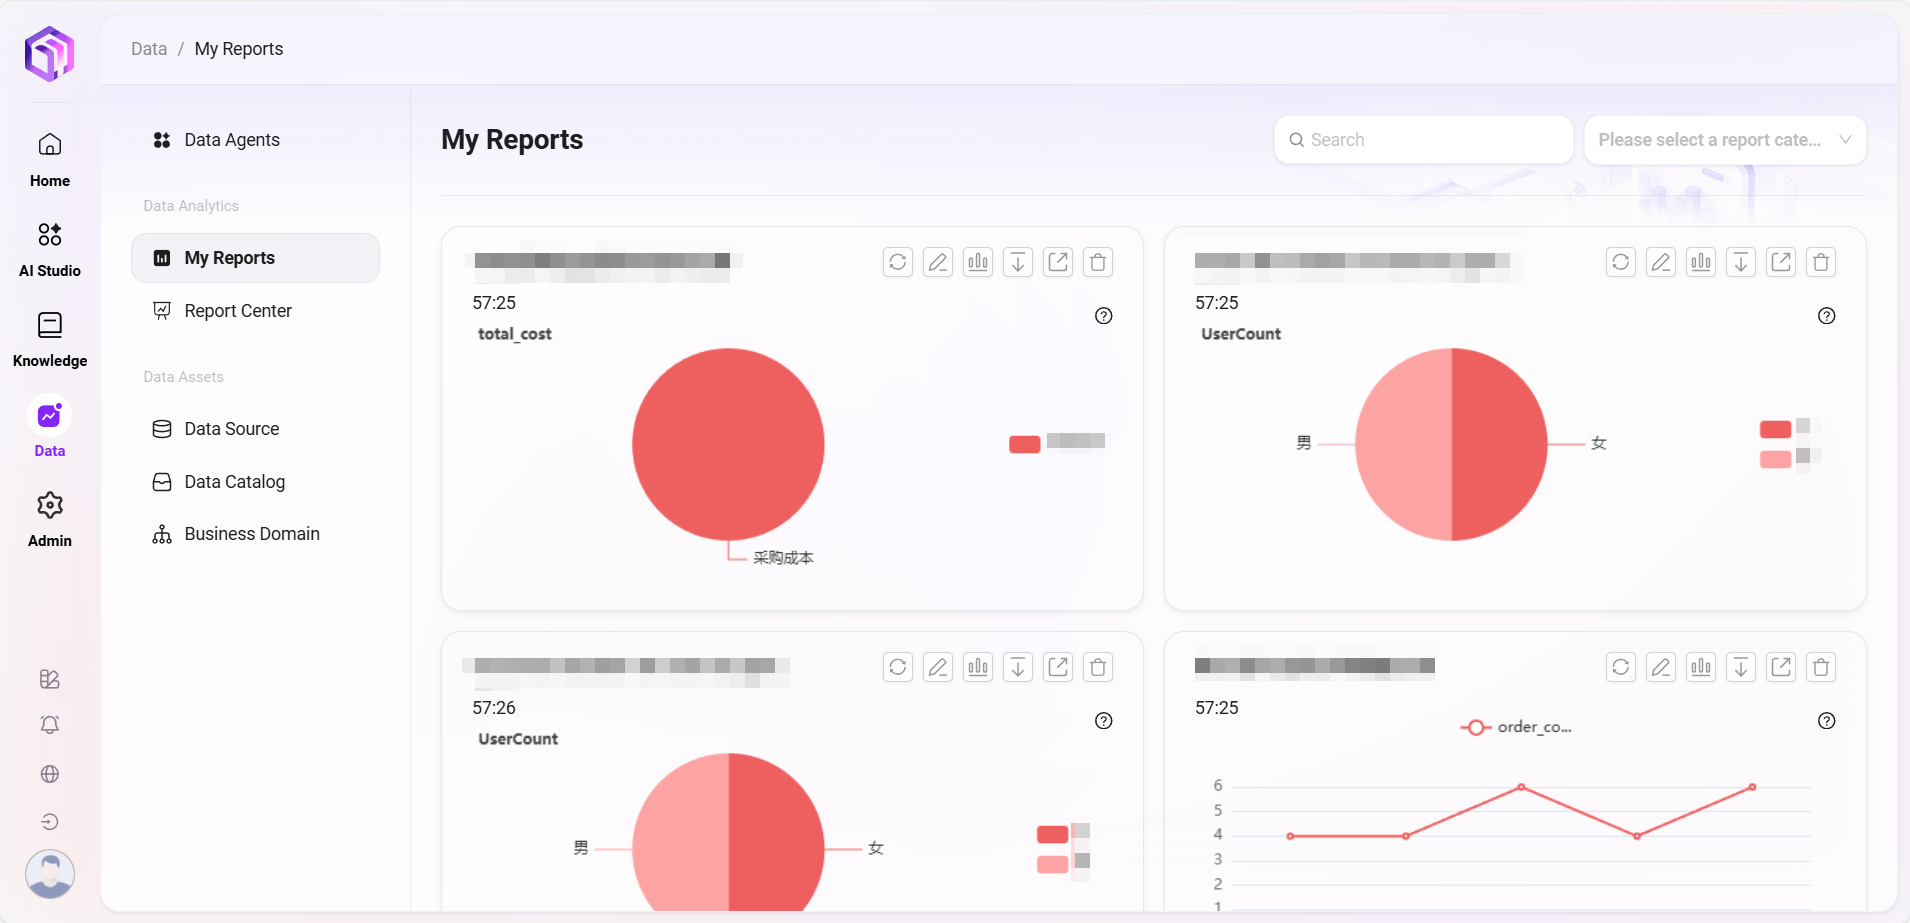
3. Analysis Management
- In "My Analysis", users can edit, rename, share, download, or delete published analyses;
- The "Analysis Center" provides a global summary of analyses, supporting category viewing and favorites.
Summary
Through the streamlined path of "Data Sources → Data Assets → Business Domain → Intelligent BI → Analysis", the Data module provides users with a complete, efficient, and intelligent data analysis and visualization solution. Users can start by connecting multiple types of data sources, selectively synchronize metadata, master table structures and field information through the Data Assets module, and leverage the Business Domain to build complex business logic models, bridging semantic relationships between data.
In the Intelligent BI module, the system significantly lowers the analysis threshold through natural language recognition, intelligent chart generation, and AI insight analysis, enabling even non-technical business users to quickly get started. Ultimately, users can publish, manage, and share generated charts as analyses, supporting internal organizational knowledge sharing and external output.
Throughout the process, the system consistently embodies the design philosophy of "low-code, high intelligence, strong integration", balancing ease of use for business users with extensibility for professional users, truly achieving a full-link closed loop from data access, modeling, analysis, insight to decision support, effectively accelerating enterprises' transformation and upgrading into data-driven organizations.